Solar energy projects use project finance modeling to predict project cash flows, analyse financing options, analyse construction and operating risks, and assess viability for investment for a period of 20-25 years of operation. These models are a valuable tool for the analysts and lenders involved in structuring the debt, calculating returns, and assisting with financing decisions throughout the entire project lifecycle, from pre-financial close to operations.
What Is Project Finance Modeling for Solar Energy Projects?
Project finance modeling for solar energy is the process of creating a financial model that predicts all of the project-level income, expenses, debt service, and investor returns for the lifetime of a solar plant. Unlike corporate finance models, the model is a special purpose vehicle (SPV) level and separates the project cash flows from the sponsor’s balance sheets. The model informs critical financing decisions such as debt sizing, debt repayment schedules, equity return analysis, etc.
These are the models that, in practice, include the forecasts for electricity generation, power purchase agreement (PPA) terms, capital expenditure schedules, operating costs, and debt structures. The output (set of projected cash flows, coverage ratios, return metrics) is evaluated by lenders, equity sponsors, and project developers to determine if a solar project is bankable and financially viable.
Why Are Solar Energy Projects Well Suited to Project Finance Structures?
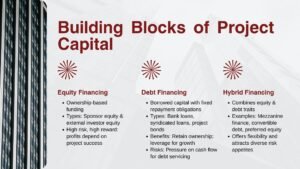
Project finance structures are ideal for solar energy projects due to their long-term, predictable cash flow and fixed-price PPAs. It provides the lenders with revenue certainty, and they can make a debt repayment schedule with a high degree of certainty because the project has cash flows in the future as their main security, instead of the assets of the sponsor. Project finance is an appropriate financing mechanism for solar assets because it involves a limited or non-recourse approach.
Further, solar projects have clearly defined cost structures. The CAPEX is focused on construction and is relatively stable during the operating period. This consistency allows for easier modeling, stress-testing, and financing of solar projects than those that have variable operational costs or revenue.
What Inputs Are Required Before Building a Solar Project Finance Model?
Analysts need to collect technical, commercial and financial inputs before developing a solar project finance model. The technical inputs are installed capacity (MW), capacity factor (%), degradation rate of the panels and project life. Commercial inputs include the PPA tariff rate, contract duration and any merchant revenue assumptions outside of the PPA. Financial inputs are CAPEX estimates, OPEX budgets, debt terms, equity contributions, and the necessary balance in the reserve account.
DSCRs are extremely sensitive to the inputs, where errors in any one assumption (especially the capacity factor or PPA rate) can have a material impact on the calculations and the resulting IRR outputs. The professional project finance analyst usually draws information for the model from independent technical assessors, legal advisors and lender due diligence reports.
Table 1: Key Inputs for a Solar Project Finance Model
| Input Category | Example Value | Purpose in Model |
| Installed Capacity | 100 MW | Sets total generation potential |
| Capacity Factor | 18%–22% | Determines actual annual output |
| Electricity Tariff (PPA Rate) | SGD 0.08/kWh (fixed) | Primary revenue driver |
| Project Life | 25 years | Defines cash flow horizon |
| Capital Expenditure (CAPEX) | USD 90 million | Total project development cost |
| Operating Expenditure (OPEX) | USD 1.2 million/year | Annual operating cost base |
| Debt-to-Equity Ratio | 70:30 | Financing structure split |
| Interest Rate (Senior Debt) | 5.5% per annum | Debt service cost |
| Degradation Rate | 0.5% per year | Annual output decline |
| Inflation Assumption | 2.5% per year | OPEX escalation factor |
How Are Solar Energy Revenues Forecasted in Financial Models?
Energy revenues from solar power are predicted using the amount of electricity produced (MWh) and the tariff rate (kWh or MWh). If the project has a PPA, the tariff is a predetermined amount that either increases or decreases in a set formula, thereby making revenue prediction much easier. Analysts use an agreed PPA rate over the contract term and have a merchant revenue model for the post-PPA term with conservative spot price projections.
Degradation, curtailment, and availability losses must also be considered. Most analysts use a factor of 0.4% – 0.7% per annum to diminish the amount of energy produced over time, representing the natural degradation of efficiency of the panels. Grid curtailment assumptions (typically 2% – 5%) reduce net generation available for sale.
Table 2: Solar Project Revenue Drivers and Modeling Approach
| Revenue Driver | Modeling Approach | Impact on Project Cash Flow |
| Electricity Generation (MWh) | Capacity × Capacity Factor × 8,760 hours | Determines total annual energy sales |
| PPA Tariff Rate | Fixed or indexed contract rate | Core revenue per unit of output |
| Capacity Factor | Historical irradiance and plant efficiency data | Adjusts generation volume annually |
| Curtailment Rate | Grid operator estimates (typically 2%–5%) | Reduces billable generation |
| Panel Degradation | 0.4%–0.7% annual decline applied to output | Reduces long-term revenue trajectory |
| Merchant Revenue (if applicable) | Spot price forecasts post-PPA period | Adds market risk to later cash flows |
How Is Electricity Generation Modeled for Solar Projects?
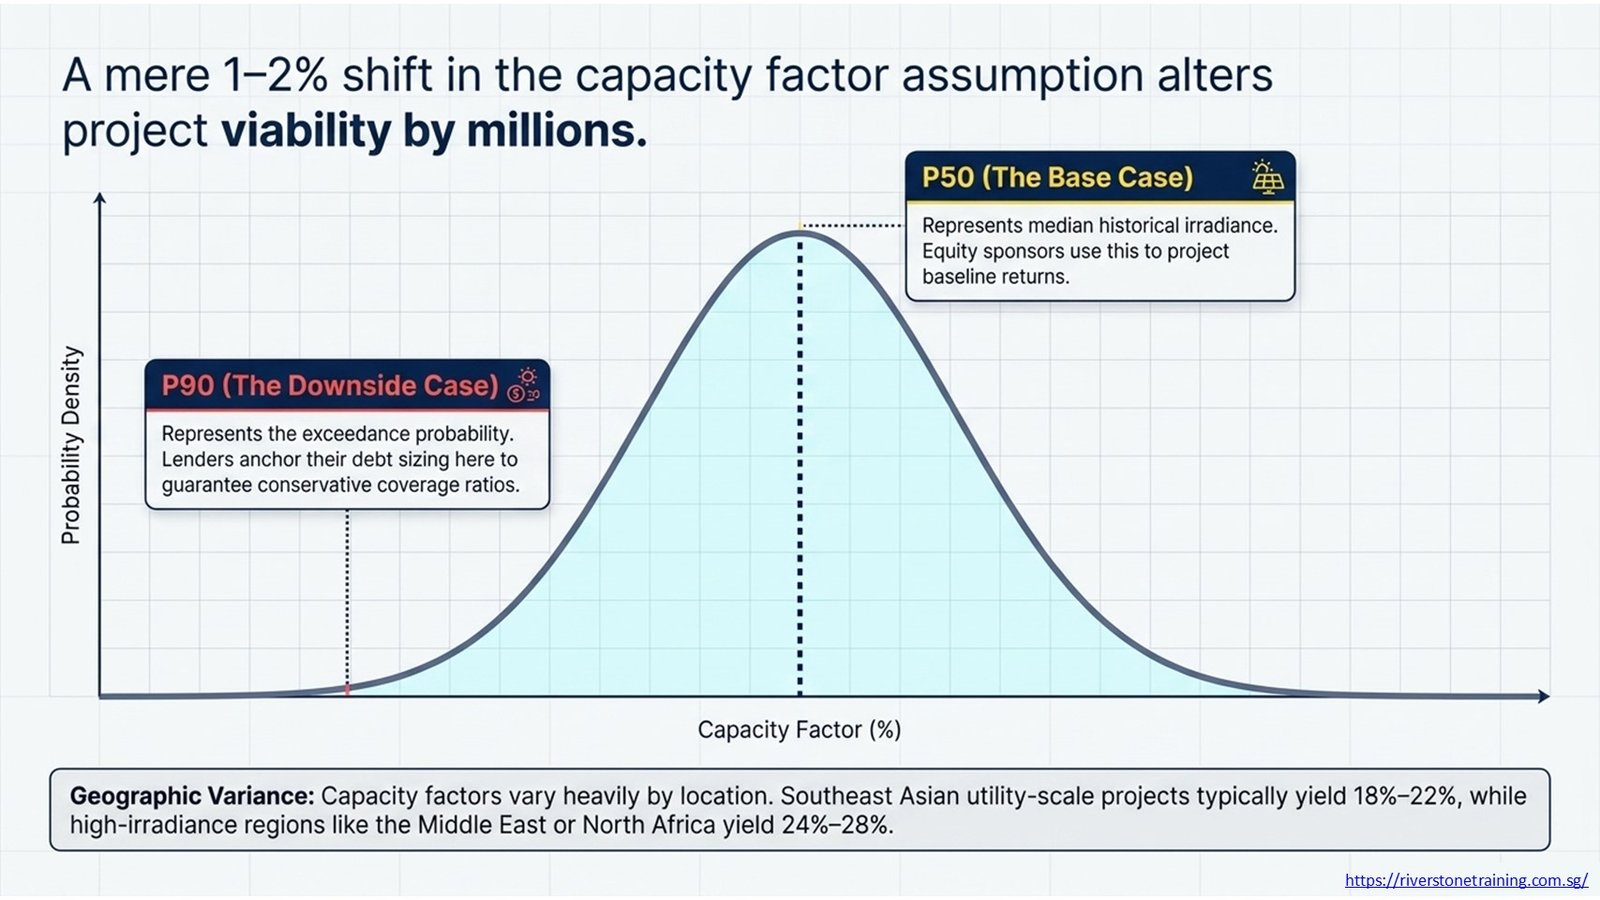
The formula to model electricity generation is: Annual Generation (MWh) = Installed Capacity (MW) × Capacity Factor (%) × 8,760 hours per year. The capacity factor is calculated from the historical solar radiation data from the project site, corrected for the efficiency of the solar panels, the losses of the system, and the shading effects. Typically, independent energy assessors would give P50 (median) and P90 (exceedance probability) generation figures, using the P50 as the base case and P90 as a downside case.
Analysts create generation schedules based on the degradation profile and any additions or repowering that are scheduled for the project’s life. The direct linkage between generation and revenue generation, along with DSCR calculations, means that the model automatically reacts to variations in key assumptions that could occur throughout the lender due diligence and scenario testing process.
How Do Solar Capacity Factors Affect Project Cash Flow Forecasts?
One of the most critical parameters to be sensitive to in a solar project finance model is the capacity factor. It directly influences the amount of electricity produced and, in turn, the total income of the project. The capacity factor for a solar project in Southeast Asia can be 18%–22%, and can be 24%–28% for projects in high-irradiance areas such as the Middle East or North Africa. For a utility-scale project, a 1-2% difference in the assumed capacity factor can have a significant impact on annual revenue, making millions of dollars difference on a project.
The P90 generation estimate is the parameter that most lenders and investors base debt sizing on, and typically use to size a debt to ensure a conservative coverage ratio. Equity sponsors can, however, use the P50 estimate to make base case returns projections. Analysts take advantage of the range between P50 and P90 outputs to test the debt service coverage in realistic downside scenarios, which represents the sensitivity range.
How Are Operating and Maintenance Costs Incorporated Into Solar Project Models?
The operating and maintenance (O&M) costs are included as annual cash outflows in the project income and cash flow statement. Common OPEX expenses for a solar project involve land lease or rent, panel cleaning and maintenance, maintenance costs for the inverter, insurance costs, connection to the grid, and asset management fees. These costs are typically tied to inflation, and analysts use an annual escalation rate (typically 2% to 3%) to predict OPEX over the entire operating life.
A well-structured Solar Project Finance model includes the identification of Fixed OPEX (Annual Land Rental, Project Management Fees) and the Variable OPEX (Maintenance Based on Generation Output) to enable more granular sensitivity testing. The major life cycle replacement components, such as inverter replacement at 10–15 years of life, are modeled as a single capital expenditure rather than as an OPEX, thus correctly capturing cash flow timing.
How Is Debt Structured for Solar Energy Projects?
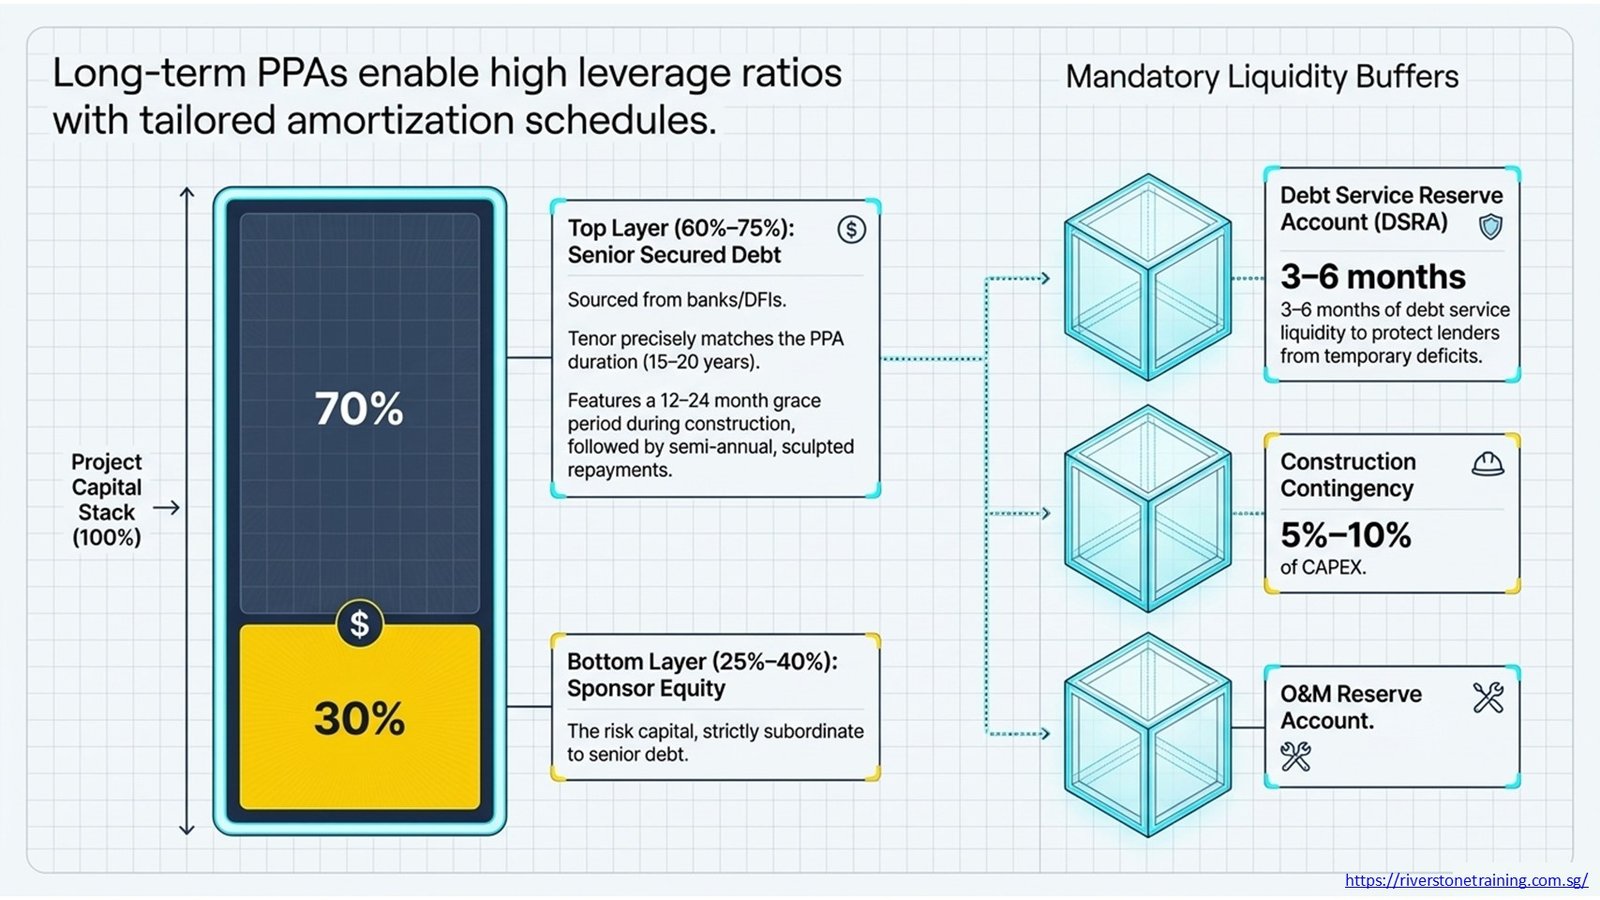
Financial structures for solar energy projects generally are a senior secured term loan of 60% to 75% of project costs, and the balance 25% to 40% will be equity, provided by the sponsors. The term of the loan is typically 15–20 years, matching the duration of the PPA contract to maximize cash flows for repaying the loan. Typically, the repayment will be modeled on a semi-annual basis, and the repayment will be set up in a semi-annuity or sculpted manner that matches the debt service to the available cash flows.
Reserve accounts also have to be factored in with project finance models. Generally, a debt service reserve account (DSRA) will contain a three to six-month reserve for debt service for the lender(s), which offers liquidity protection for the lender(s) in the event of temporary debt service deficits. During the construction period, reserves account funding and drawdowns during stress periods in operation will be modeled to ensure that cash movements will be accurately reflected in the model.
Table 3: Debt and Equity Financing Structure for Solar Projects
| Financing Component | Typical Share | Purpose in Project Finance |
| Senior Debt (Term Loan) | 60%–75% of the total cost | Primary project financing from banks or DFIs |
| Equity (Sponsor Investment) | 25%–40% of the total cost | Risk capital; subordinate to senior debt |
| Debt Service Reserve Account (DSRA) | 3–6 months debt service | Liquidity buffer for lenders |
| O&M Reserve Account | Project-specific | Ensures operational cost coverage |
| Construction Contingency | 5%–10% of CAPEX | Covers cost overruns during the build phase |
| Debt Tenor | 15–20 years | Matches project cash flow duration |
| Grace Period | 12–24 months during construction | No principal repayment during the build phase |
How Do Lenders Evaluate Solar Project Cash Flows?
By examining a solar project’s capacity to produce enough cash from its operations to meet debt repayments, lenders review the cash flows of a solar project. The key metric is the amount of Cash Flow Available for Debt Service (CFADS or (Revenue – OPEX – Taxes – Change in Working Capital). CFADS is the numerator of the DSCR, and it is the real cash generating ability of the project in each period.
The cash flow waterfall is also examined to show how cash is paid out from project revenues. In general, the operating costs will be scheduled to be paid first, then the senior debt service, the reserve account funding, and lastly equity distributions. The model, which explicitly models this waterfall, confirms that the senior lender is protected in all scenarios and that the equity owners receive returns after the debt owners are paid.
How Is DSCR Used in Solar Project Finance Modeling?
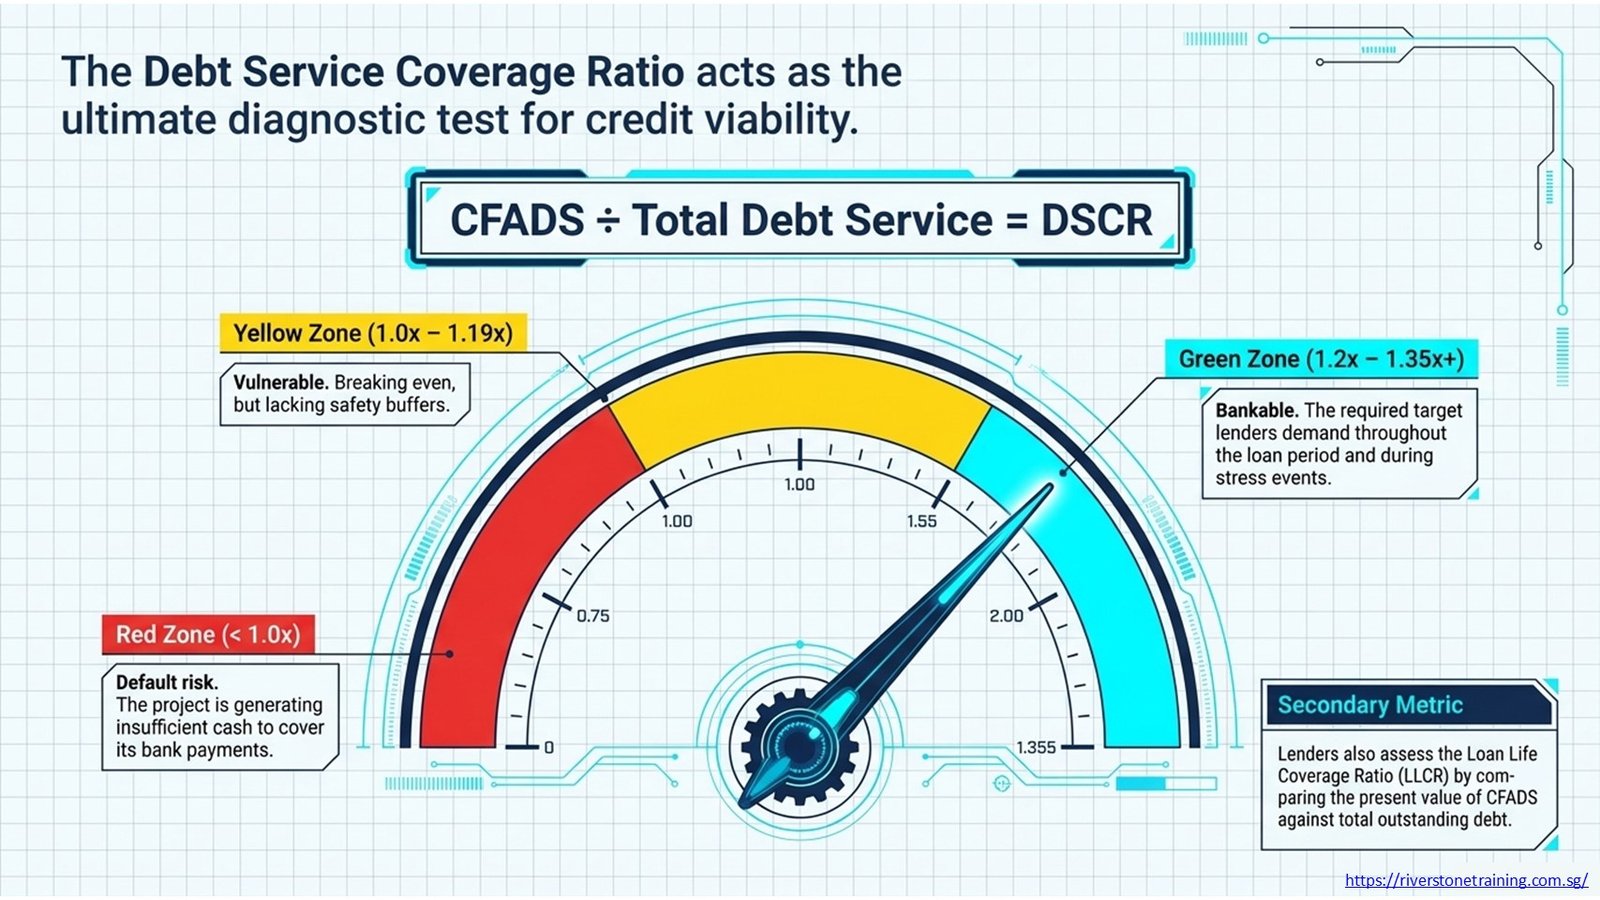
Debt Service Coverage Ratio (DSCR) is the top credit criterion lenders employ in solar energy project financing. It’s determined by dividing CFADS by the Total Debt Service, which is the sum of the principal and interest. A DSCR of 1.0x indicates that the project is operating with just enough cash to cover debt repayments, and lenders generally demand a DSCR of 1.2x to 1.35x or higher for solar projects throughout the loan period and during periods of stress.
DSCR analysis comprises the annual and average (or minimum) DSCR. Another ratio calculated by analysts is called the Loan Life Coverage Ratio (LLCR), which compares the current value of CFADS to the remaining loan life to outstanding debt. These ratios can be combined to determine if the project offers sufficient coverage at base, downside, and stress levels. Professionals desiring to build these analytical skills may take a course on project finance modeling of renewable energy, which incorporates modeling of DSCR and lender credit analysis techniques.
How Are NPV and IRR Calculated for Solar Investments?
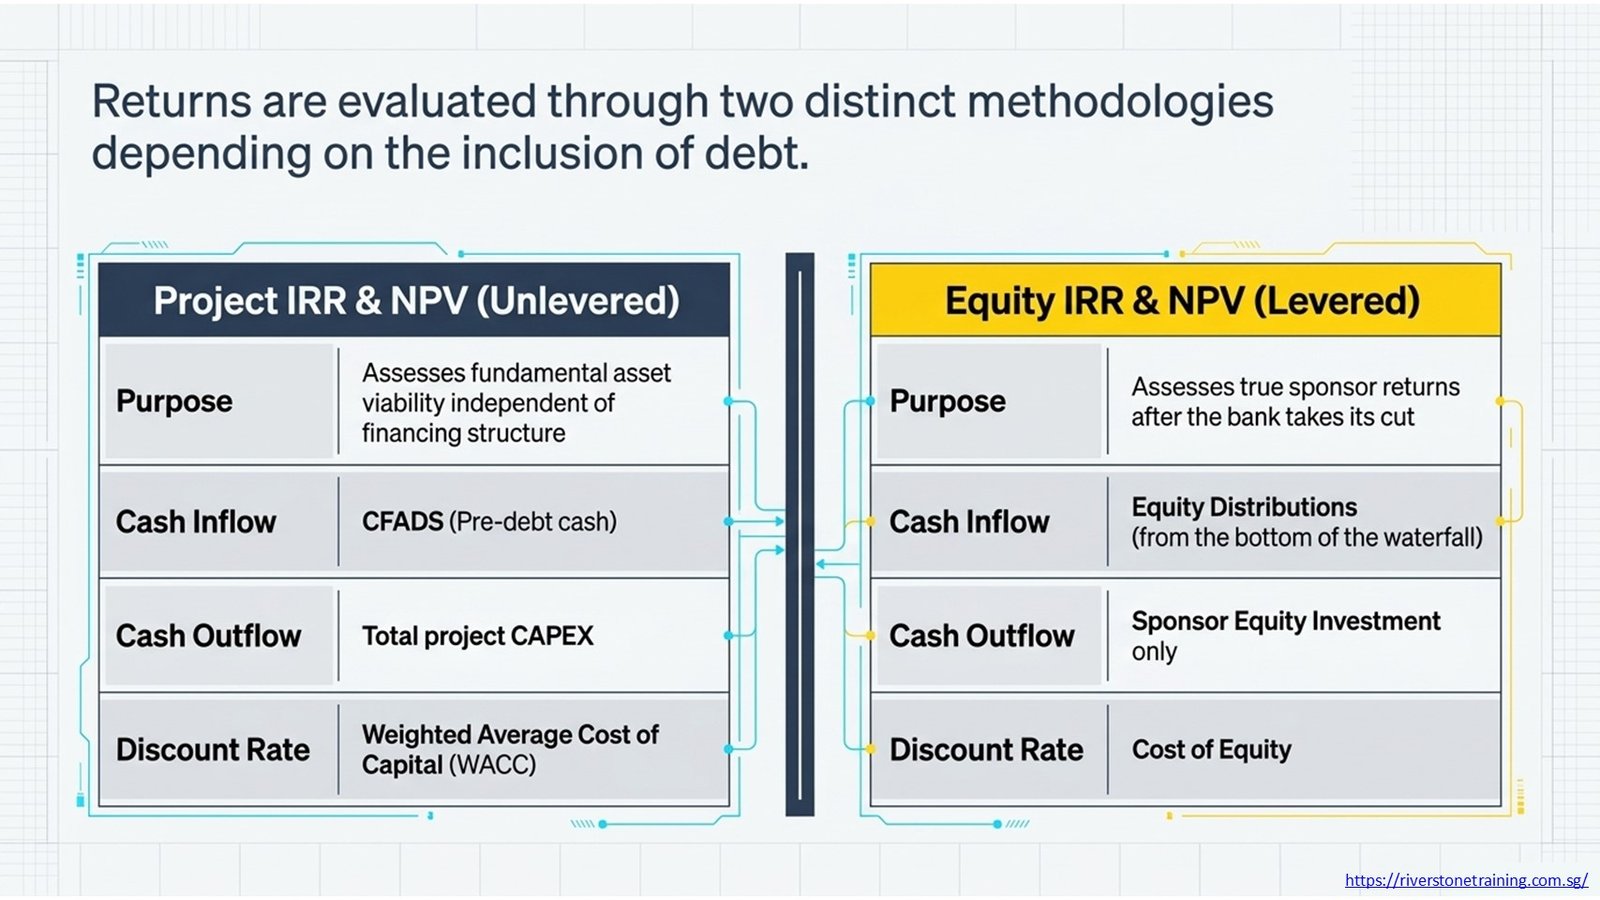
NPV and IRR are the key investment return indicators for solar project finance models. Project IRR is calculated without taking into account financing, and the cash flow stream is CFADS (cash inflow), and the initial cash flow stream is CAPEX (cash outflow). The Equity IRR calculation is the return to equity sponsors after debt service and requires equity investment to be the outflow and equity distributions to be the inflow. The project finance modeling of solar energy resources provides a full application guide for these metrics in renewable energy applications.
All the future project cash flows are discounted at a selected discount rate (the weighted average cost of capital for project NPV or equity cost of capital for equity NPV). If the NPV is positive, this means that the project creates value over the required return level. Both of these are key to the investment committee approvals, equity raising, and project comparison within a portfolio of renewable energy projects.
How Do Scenario and Sensitivity Analysis Improve Solar Project Evaluation?
Using scenario analysis helps to evaluate solar projects based on a variety of assumptions, and to understand how the project’s model outputs (DSCR, IRR, and NPV) will change. Examples of usual situations include a Base Case (P50 generation, contracted PPA rate), a Downside Case (P90 generation, higher OPEX, potential curtailment), and a Stress Case (P90 generation with reduced tariff or construction delay). The different scenarios generate unique cash flow and coverage ratios, giving lenders and investors an idea of the potential outcomes.
Sensitivity analysis identifies the effect that one variable at a time has on important model results. Sensitivity to the capacity factor, the PPA rate, OPEX escalation, interest rate, and CAPEX overrun is typically tested by analysts. A tornado chart or sensitivity table prioritizes the variables by their effect on project IRR or minimum DSCR for the decision maker to use for risk management.
What Risks Are Commonly Tested in Solar Energy Financial Models?
A streamlined list of risks is used to test solar project finance models that may impact cash flow generation and debt repayments. The most significant material risks involve lower than expected solar irradiance (which results in lower production than anticipated in the PPA), construction delays (which result in higher costs and later start of revenues), counterparty default under the PPA (which means no contracted revenue) and O&M cost overruns (which lead to lower net cash flow available for debt servicing).
Each risk is modeled using scenario analysis and sensitivity analysis, with the establishment of break-even thresholds – the minimum capacity factor and maximum OPEX, which will keep the project in debt service. Such break-even analyses are a critical component of information memoranda for lenders and presentations to credit committees, and provide evidence that the project is able to weather adverse conditions without going negative.
Table 4: Solar Project Risks and Financial Model Mitigation Strategies
| Risk Category | Potential Impact | Mitigation Strategy in Model |
| Lower Solar Irradiance (P90 vs P50) | 10%–15% generation shortfall | Model P90 case as a downside scenario |
| Construction Delay | Cost overruns, revenue delay | Include contingency and a grace period |
| PPA Counterparty Default | Loss of contracted revenue | Stress-test merchant revenue assumption |
| O&M Cost Overruns | Reduced CFADS and DSCR | Apply 10%–20% cost escalation in sensitivity |
| Interest Rate Changes (floating debt) | Higher debt service burden | Model rate floors and caps |
| Grid Curtailment Increase | Reduced revenue volume | Test 5%–10% curtailment scenarios |
| Panel Degradation Acceleration | Faster output decline | Increase the degradation rate in the downside case |
| Regulatory/Tariff Changes | Reduced or renegotiated PPA rate | Scenario analysis with lower tariff floor |
How Does Project Finance Modeling Support Renewable Energy Investment Decisions?
The most basic analytical tool for making renewable energy investment decisions is project finance modeling. From the equity sponsor’s perspective, the model helps to determine if the project can generate an adequate equity IRR given the risk characteristics of the investment. The model proves that the Lender’s credit policies are being adhered to for DSCR and LLCR throughout the loan tenor. The model can help project developers optimize their capital expenditures by determining the financing structure that will maximize returns within the lender’s constraints.
In addition to project finance models for specific projects, the fund managers of renewable energy funds use the models for comparing renewable energy assets, allocating fund capital, and supporting portfolio reporting. Project finance models are also used by development finance institutions (DFIs) and multilateral agencies when structuring concessional finance for solar projects in emerging markets where the cost of debt plays a crucial role for project viability, and the affordability of electricity for end-consumers.
How Are These Skills Taught in a Project Finance Modeling Course?
A project finance modelling course is a course that introduces analysts to the process of creating models for solar and renewable energy projects from scratch, with a case study approach. The participants learn how to set up the model architecture, how to populate technical and financial inputs, create revenue forecasting logic, model debt repayment schedules, calculate the DSCR and the coverage ratios, and perform scenario and sensitivity analysis. It is not a theoretical finance course, but rather focused on model functionality, accuracy and application.
Usually, training consists of the entire deal lifecycle: pre-financial close feasibility modeling, lender due diligence support, financial close structuring, and operations-phase reporting. Project finance modeling skills are directly transferable to careers in renewable energy finance, infrastructure investment banking, project development, and credit analysis, making it a valuable course for finance professionals looking to gain a career in energy transition.
Frequently Asked Questions
What is project finance modeling for solar energy projects?
Project finance modelling for solar projects involves projecting cash flows, repayment capacity of the debt and returns to the investors to assess the viability and financing structure of the project.
Why are solar projects commonly financed using project finance structures?
Project finance is an appropriate structure for solar projects due to its ability to provide long-term cash flows through PPA’s.
What is a capacity factor in solar project modeling?
The capacity factor is a metric that compares the actual electricity output of a solar plant with the maximum output it could produce during a certain amount of time.
How is DSCR used in solar project finance?
To determine whether a solar project has enough cash flow to cover its debt payment requirements, it is used to evaluate the DSR.
Why are NPV and IRR important in renewable energy investments?
NPV and IRR are used to help assess project profitability, to compare investment opportunities, and for financial decision-making.
What is a power purchase agreement and why does it matter in project finance models?
A Power Purchase Agreement sets the revenue structure of a solar project by specifying the terms and conditions for the electricity purchase as well as the obligations of the offtaker.
Conclusion
Project finance modeling is the analytical framework that helps solar power projects pass from development to financial closure and delivery. Financial models are used throughout the solar project life cycle to forecast cash flows from electricity generation, PPA revenue, calculate NPV and IRR to equity investors, and test the project’s resilience through scenario and sensitivity analysis.
These models are used by lenders to verify sufficient coverage ratios and to ensure the safety of debt. They are used by investors to compare the performance of their equity portfolios with their risk-adjusted benchmarks. They are utilized by developers to work out the most effective construction financing and make the project viable. In all scenarios, the quality of the financial model is directly related to the quality of the financing decision.
Project finance modeling skills are a practical investment in this career for finance professionals seeking to build up their expertise in renewable energy and infrastructure finance. Building, auditing, and interpreting solar project finance models is of interest to investment banks, development finance institutions, project development firms, and independent financial advisory practices, and will enable them to meaningfully contribute to the global energy transition through financing.
Table 5: Solar Project Finance Modeling — Summary of Key Modeling Areas
| Modeling Area | Key Outputs | Used By |
| Generation Forecast | Annual MWh, capacity factor | Developers, lenders, investors |
| Revenue Model | Annual revenue, PPA income | Equity sponsors, project developers |
| CAPEX and OPEX Schedule | Cost plan, drawdown schedule | Lenders, financial advisors |
| Debt Structuring | Loan sizing, repayment schedule | Senior lenders, credit analysts |
| DSCR Analysis | Annual and average DSCR | Banks, DFIs, rating agencies |
| NPV and IRR | Project and equity returns | Equity investors, fund managers |
| Scenario and Sensitivity Analysis | Downside protection thresholds | All project finance stakeholders |